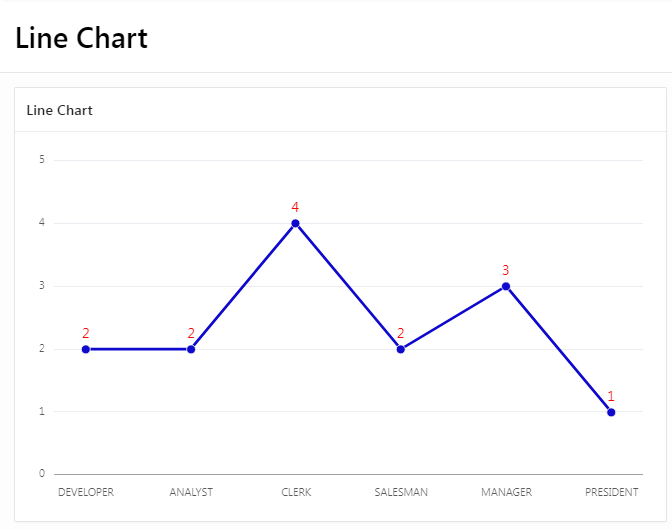
Posted inAPEX APEX Tutorials How to create Line Chart Region in Oracle APEX 22.2.0 ? A line chart is a graphical representation of data that changes over time. It is useful for showing trends and patterns in data over a period of time. In a… Posted by Harish Kumar January 5, 2023