How to Create Bubble Chart Region in Oracle APEX 22.2.0 ?
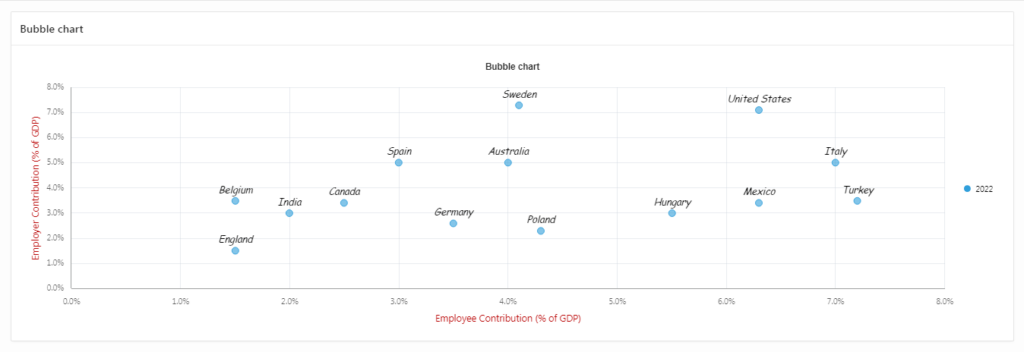
1. Sign in to Oracle Application Express by entering the credentials (Workspace, Username and Password).2. On the workspace home page, click the App Builder icon.3. Click on your Application Name in which you want to create a New Page. 4. Click on “Create Page” button. 5. Select Component tab and Select a template for your... Read more

How to Create Combination Chart Region in Oracle APEX 22.2.0 ?

A combination chart, also known as a combo chart, is a type of chart that combines two or more chart types in a single visualization. This allows you to display multiple types of data in a single chart, making it... Read more

How to create Scatter Chart Region in Oracle APEX 22.2.0 ?

A scatter chart is a type of chart that uses Cartesian coordinates to display values for typically two variables for a set of data. The position of each point on the horizontal and vertical axis represents the values of the... Read more

How to create Donut Chart Region in Oracle Apex 22.2.0 ?

3. Click on the “Create Page” button in the top menu. 4. Select Component tab and choose the “Charts” option and click on “Next”. 5. Select “Donut Chart” from the Chart Type list. There are several types of charts available, including area charts, bar charts, pie charts, and line charts etc. and... Read more

How to create Pie Chart Region in Oracle APEX 22.2.0 ?

A pie chart is a circular statistical graphic, which is divided into slices to illustrate numerical proportion. In a pie chart, the arc length of each slice is proportional to the quantity it represents. Pie charts are very useful for... Read more

How to create Line Chart Region in Oracle APEX 22.2.0 ?

A line chart is a graphical representation of data that changes over time. It is useful for showing trends and patterns in data over a period of time. In a line chart, data points are plotted on a grid and... Read more

How to create Bar Chart Region in Oracle APEX 22.2.0 ?

A bar chart is a graphical representation of data that uses rectangular bars to show the trends and variations in data over time. 3. Click on the “Create Page” button in the top menu. 4. Select Component tab and choose the “Charts” option and click on “Next”. 5. Select “Bar Chart” from... Read more

How to create Area Chart Region in Oracle APEX 22.2.0 ?

An area chart is a graphical representation of data that uses two axes (horizontal and vertical) and multiple data series to show the trends and variations in data over time. 3. Click on the “Create Page” button in the top... Read more

How to create Chart Region in Oracle APEX 22.2.0 ?

Read more

How to create “Forms” in Oracle APEX 22.2.0 ?

Form: Allows users to enter and update data in a database table or view. 1..Log in to Oracle APEX and select the application you want to work on.2..Enter your Page Name (Demo) and search in which you want to create a “Forms”. 3..Click... Read more