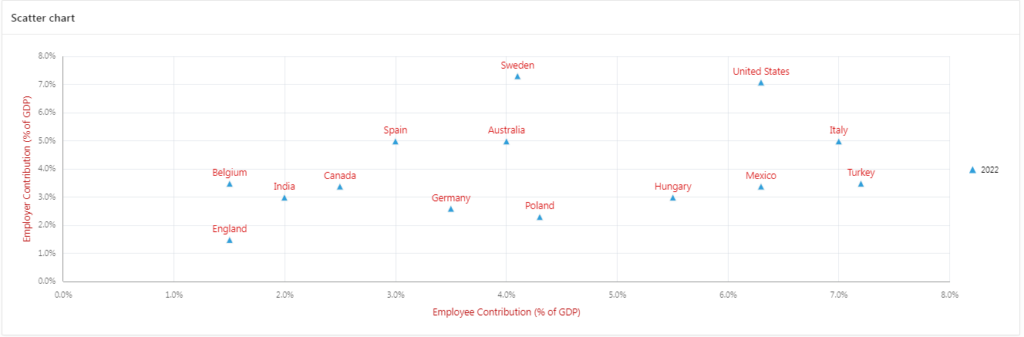
A scatter chart is a type of chart that uses Cartesian coordinates to display values for typically two variables for a set of data. The position of each point on the horizontal and vertical axis represents the values of the two variables, and the points are connected with a line or a curve. Scatter charts are often used to find correlations between variables, such as the relationship between the price of a product and its demand. They can also be used to visualize the distribution of data, such as the distribution of test scores for a class.
To create a scatter chart region in Oracle APEX 22.2.0, follow these steps:1. Sign in to Oracle Application Express by entering the credentials (Workspace, Username and Password).
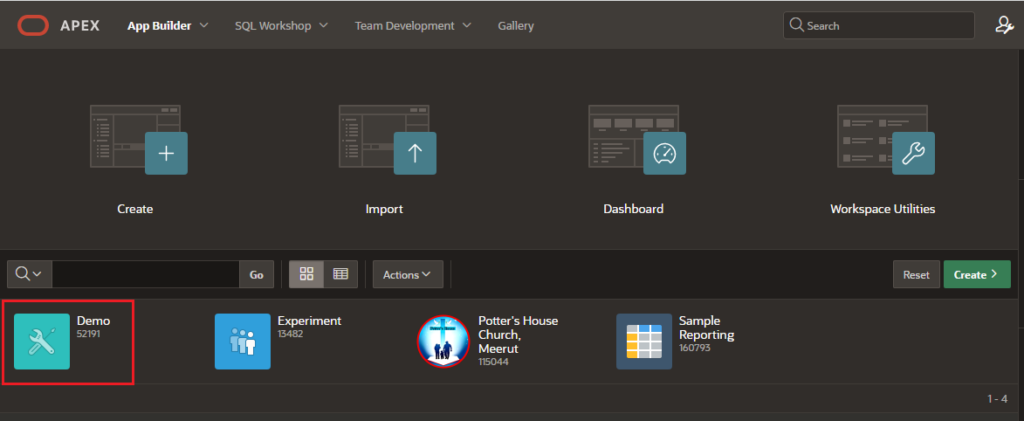
2. On the workspace home page, click the App Builder icon.
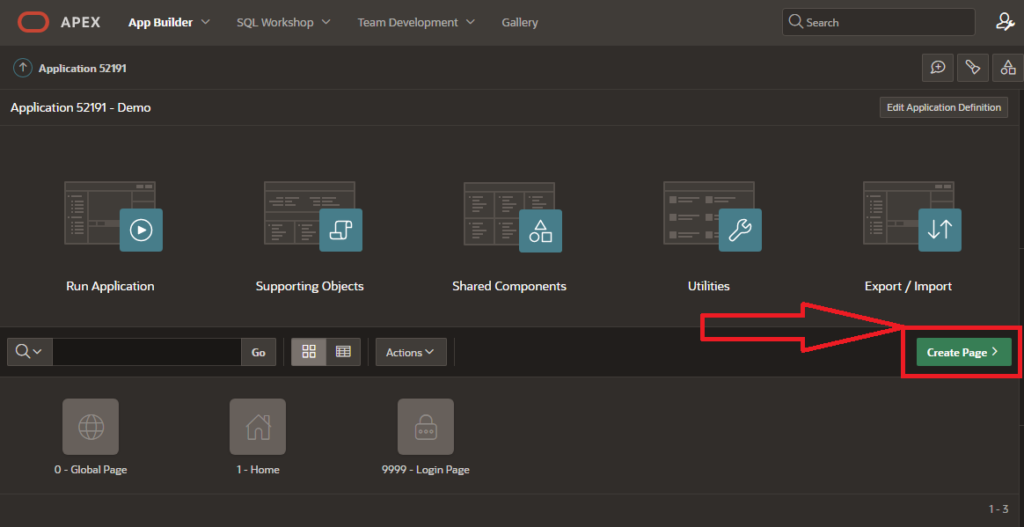
3. Click on your Application Name in which you want to create a New Page.
4. Click on “Create Page” button.
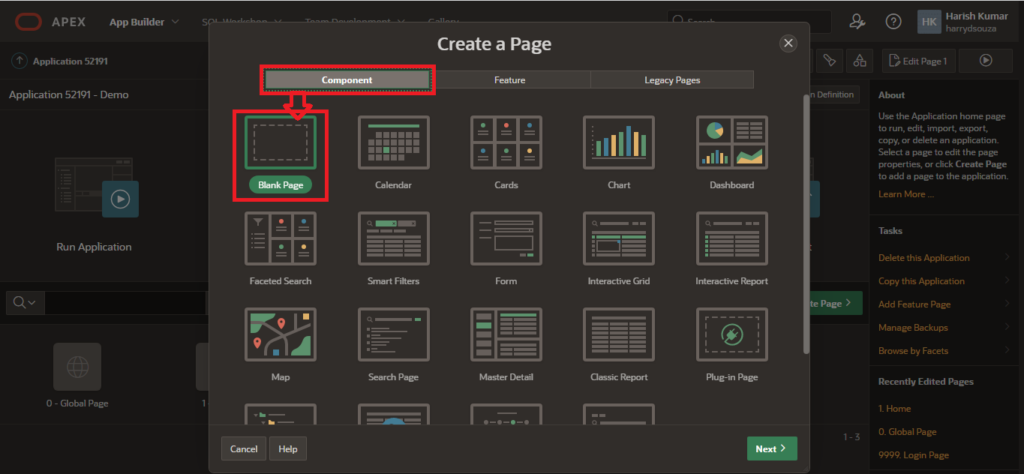
5. Select Component tab and Select a template for your page, or choose “Blank Page” if you don’t want to use a template.
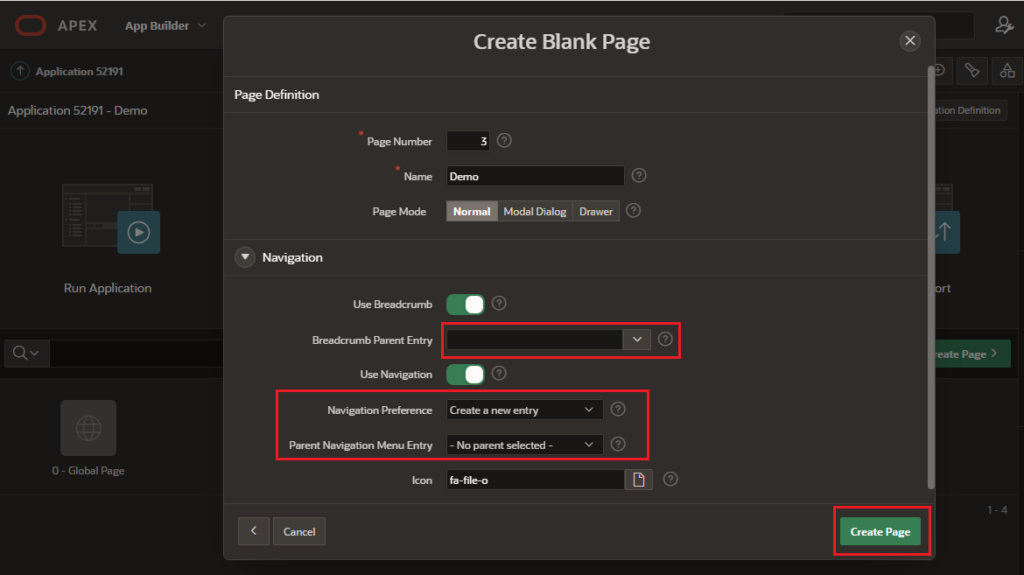
6. Enter All Mandatory Details. then click on “Create Page” button.
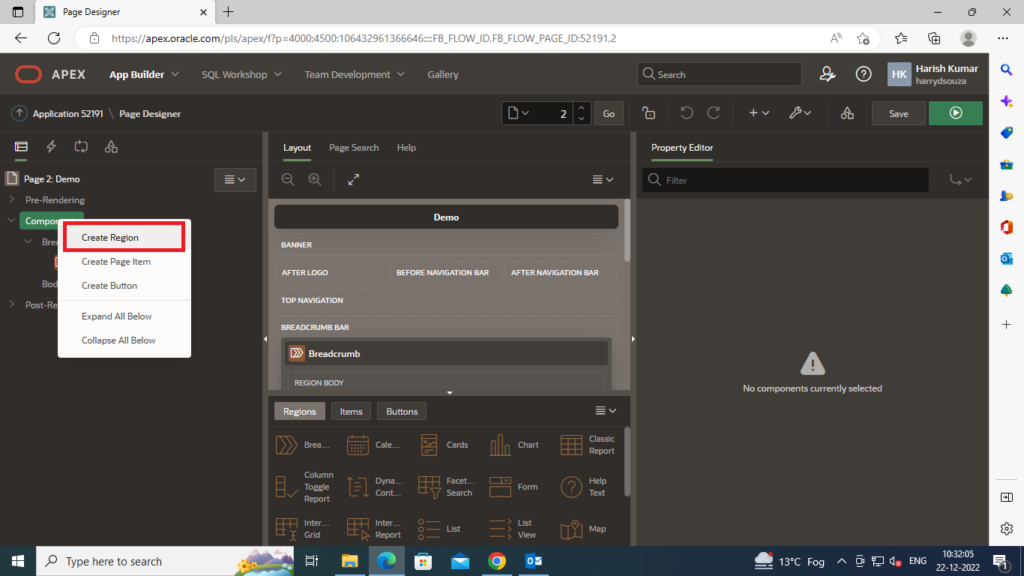
7. In the Page Designer, right click on Components section then select “Create Region”.
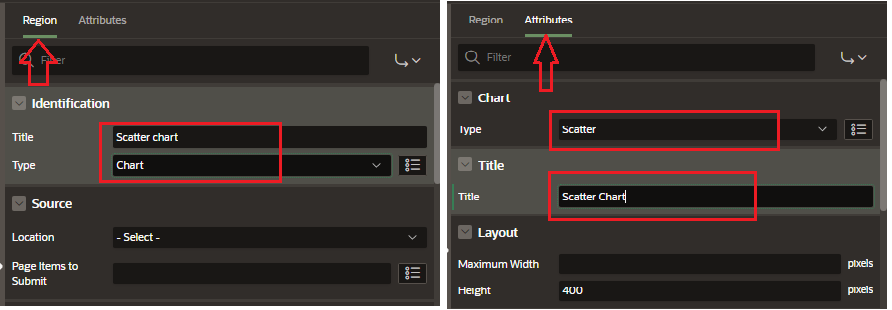
8. From the Region Type list, select “Chart” and from the Chart Type list, select “Scatter” then enter a Title for the chart region..
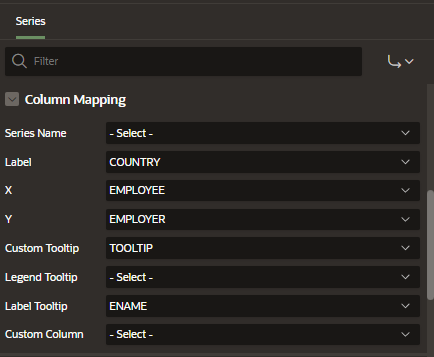
select COUNTRY country,
       ENAME,
       (EMPLOYEE_CONT/100) employee,
       (EMPLOYER_CONT/100) employer,
       country||' - Total Contribution:'||TOTAL_CONT||'%' tooltip
 from EMP;
9. Select the X-Axis and Y-Axis columns from the report data.
10. Optionally, you can customize the chart’s appearance and behavior by using the options in the Chart Attributes and Chart Legend sections.