Posted inAPEX Interactive Grid
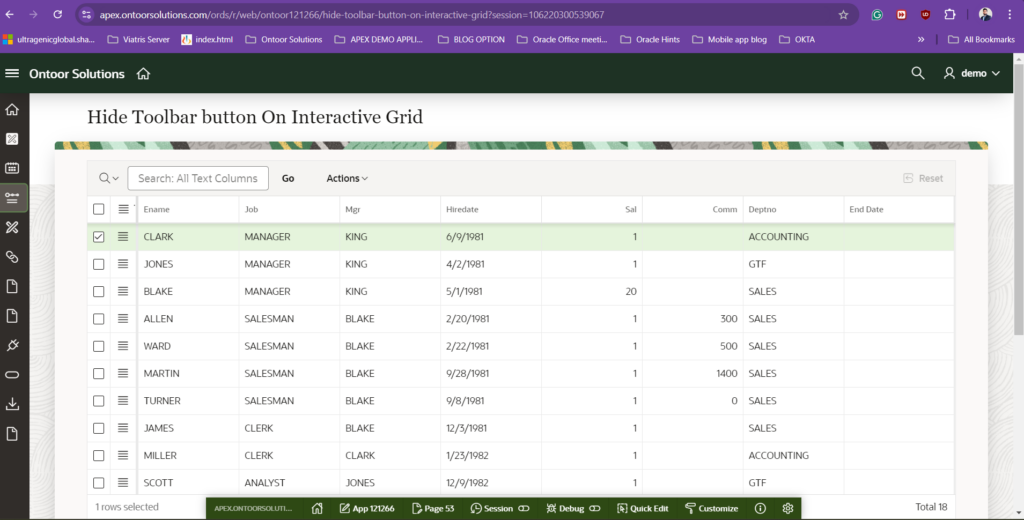
Customizing Interactive Grid Toolbars: How to Hide the Toolbar Button in Oracle APEX
Interactive Grids (IGs) in Oracle APEX provide a robust and flexible way to manage and edit data. However, there may be situations where you want to customize the toolbar to…