Posted inAPEX Interactive Report JavaScript
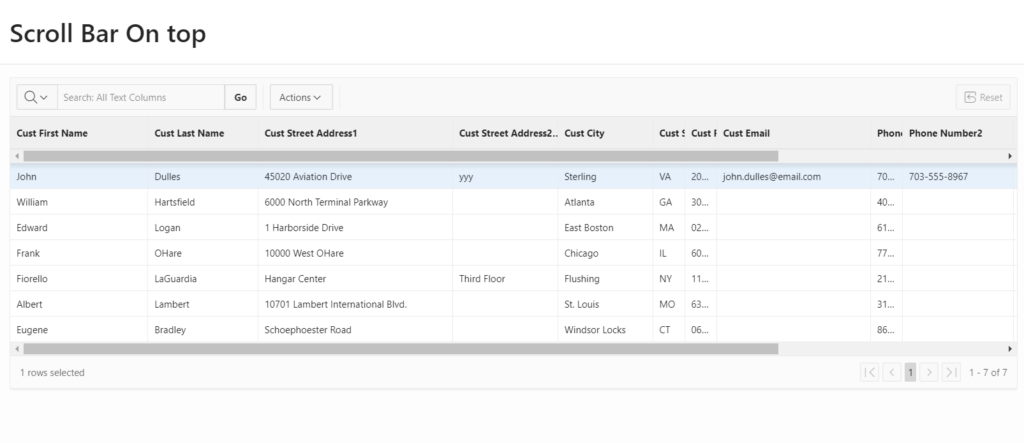
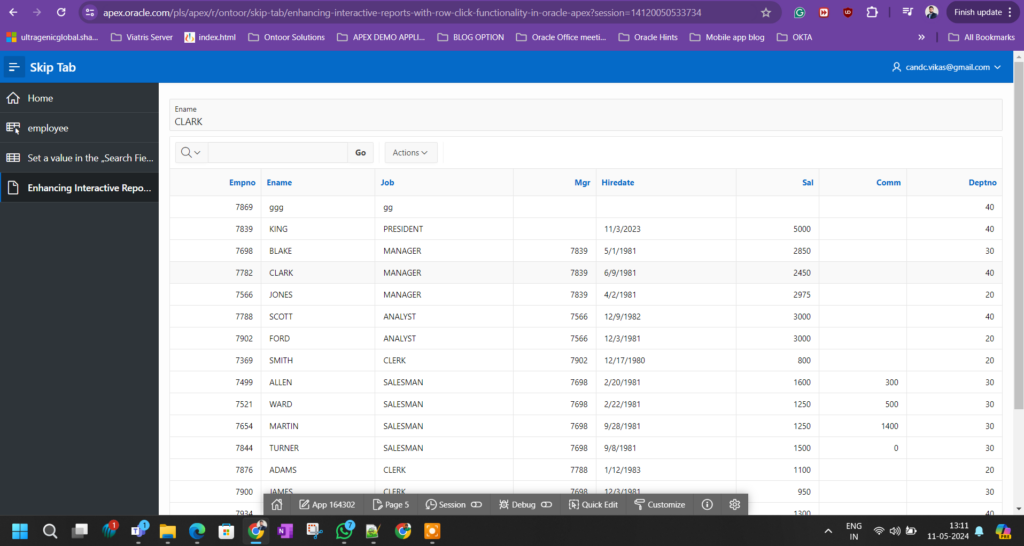
Retrieving Values on Row Click in Oracle APEX Interactive Reports
Interactive reports serve as pivotal components in Oracle Application Express (APEX), offering users a dynamic platform to explore and interact with data. Implementing row click functionality allows users to extract…