What is Session Sharing? ORACLE APEX has the ability to share sessions between multiple applications. Session sharing allows users to log in once and access multiple APEX applications without having…
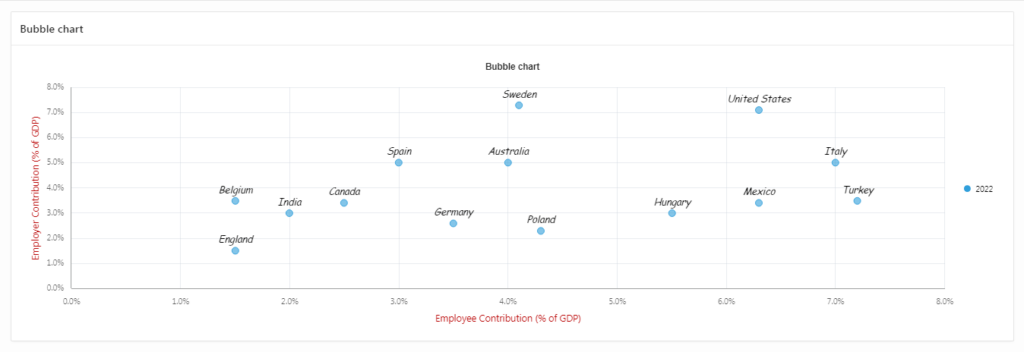
A bubble chart is a type of chart that uses bubbles to represent data points. The position of each bubble on the chart represents one or more variables, while the…
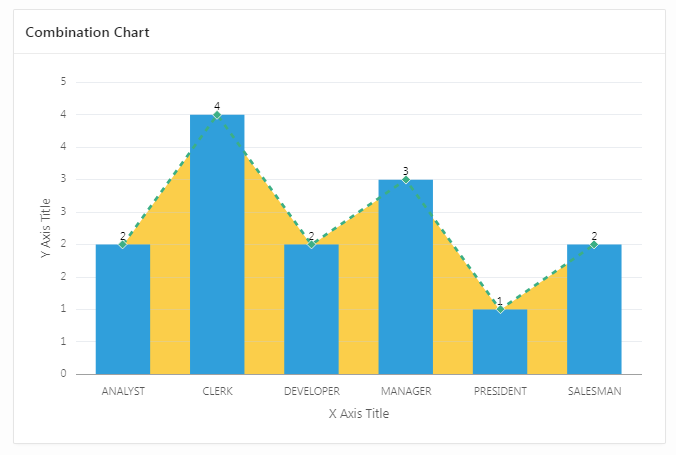
A combination chart, also known as a combo chart, is a type of chart that combines two or more chart types in a single visualization. This allows you to display…
A scatter chart is a type of chart that uses Cartesian coordinates to display values for typically two variables for a set of data. The position of each point on…
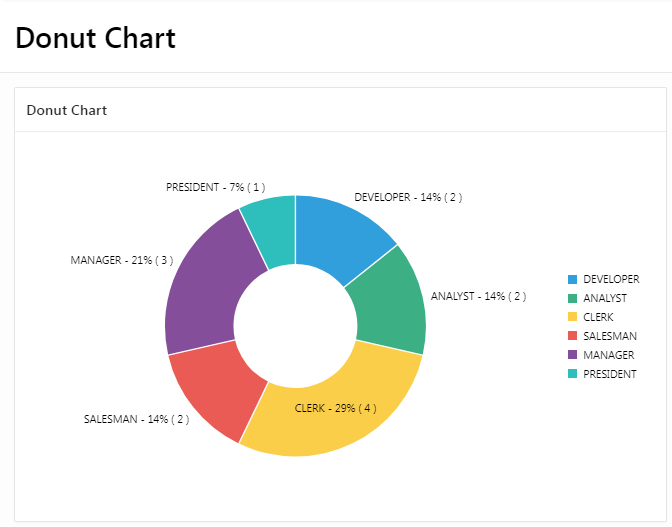
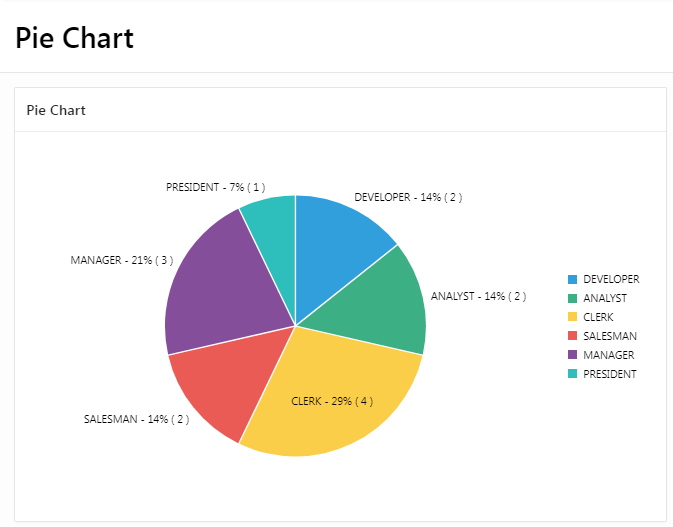
A pie chart is a circular statistical graphic, which is divided into slices to illustrate numerical proportion. In a pie chart, the arc length of each slice is proportional to…
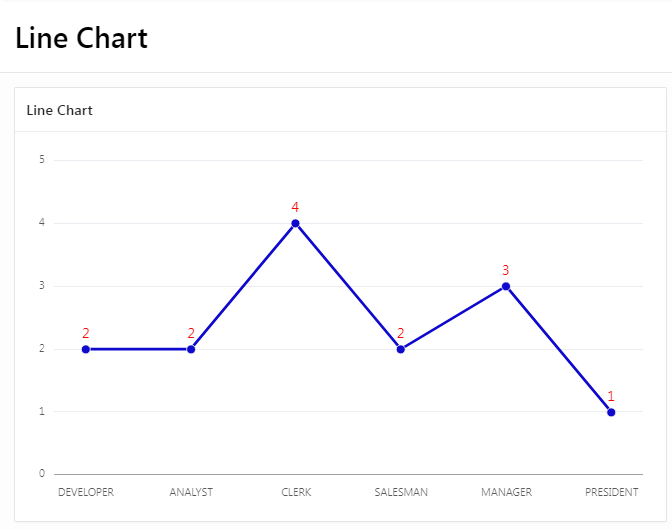
A line chart is a graphical representation of data that changes over time. It is useful for showing trends and patterns in data over a period of time. In a…
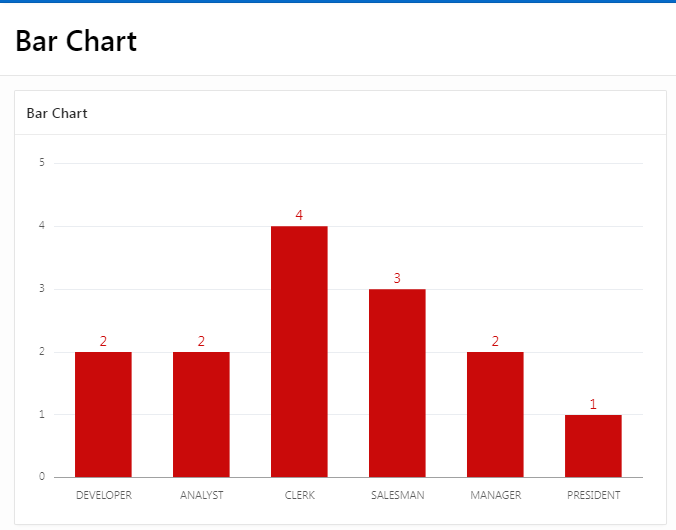
A bar chart is a graphical representation of data that uses rectangular bars to show the trends and variations in data over time. In Oracle APEX, you can create a…