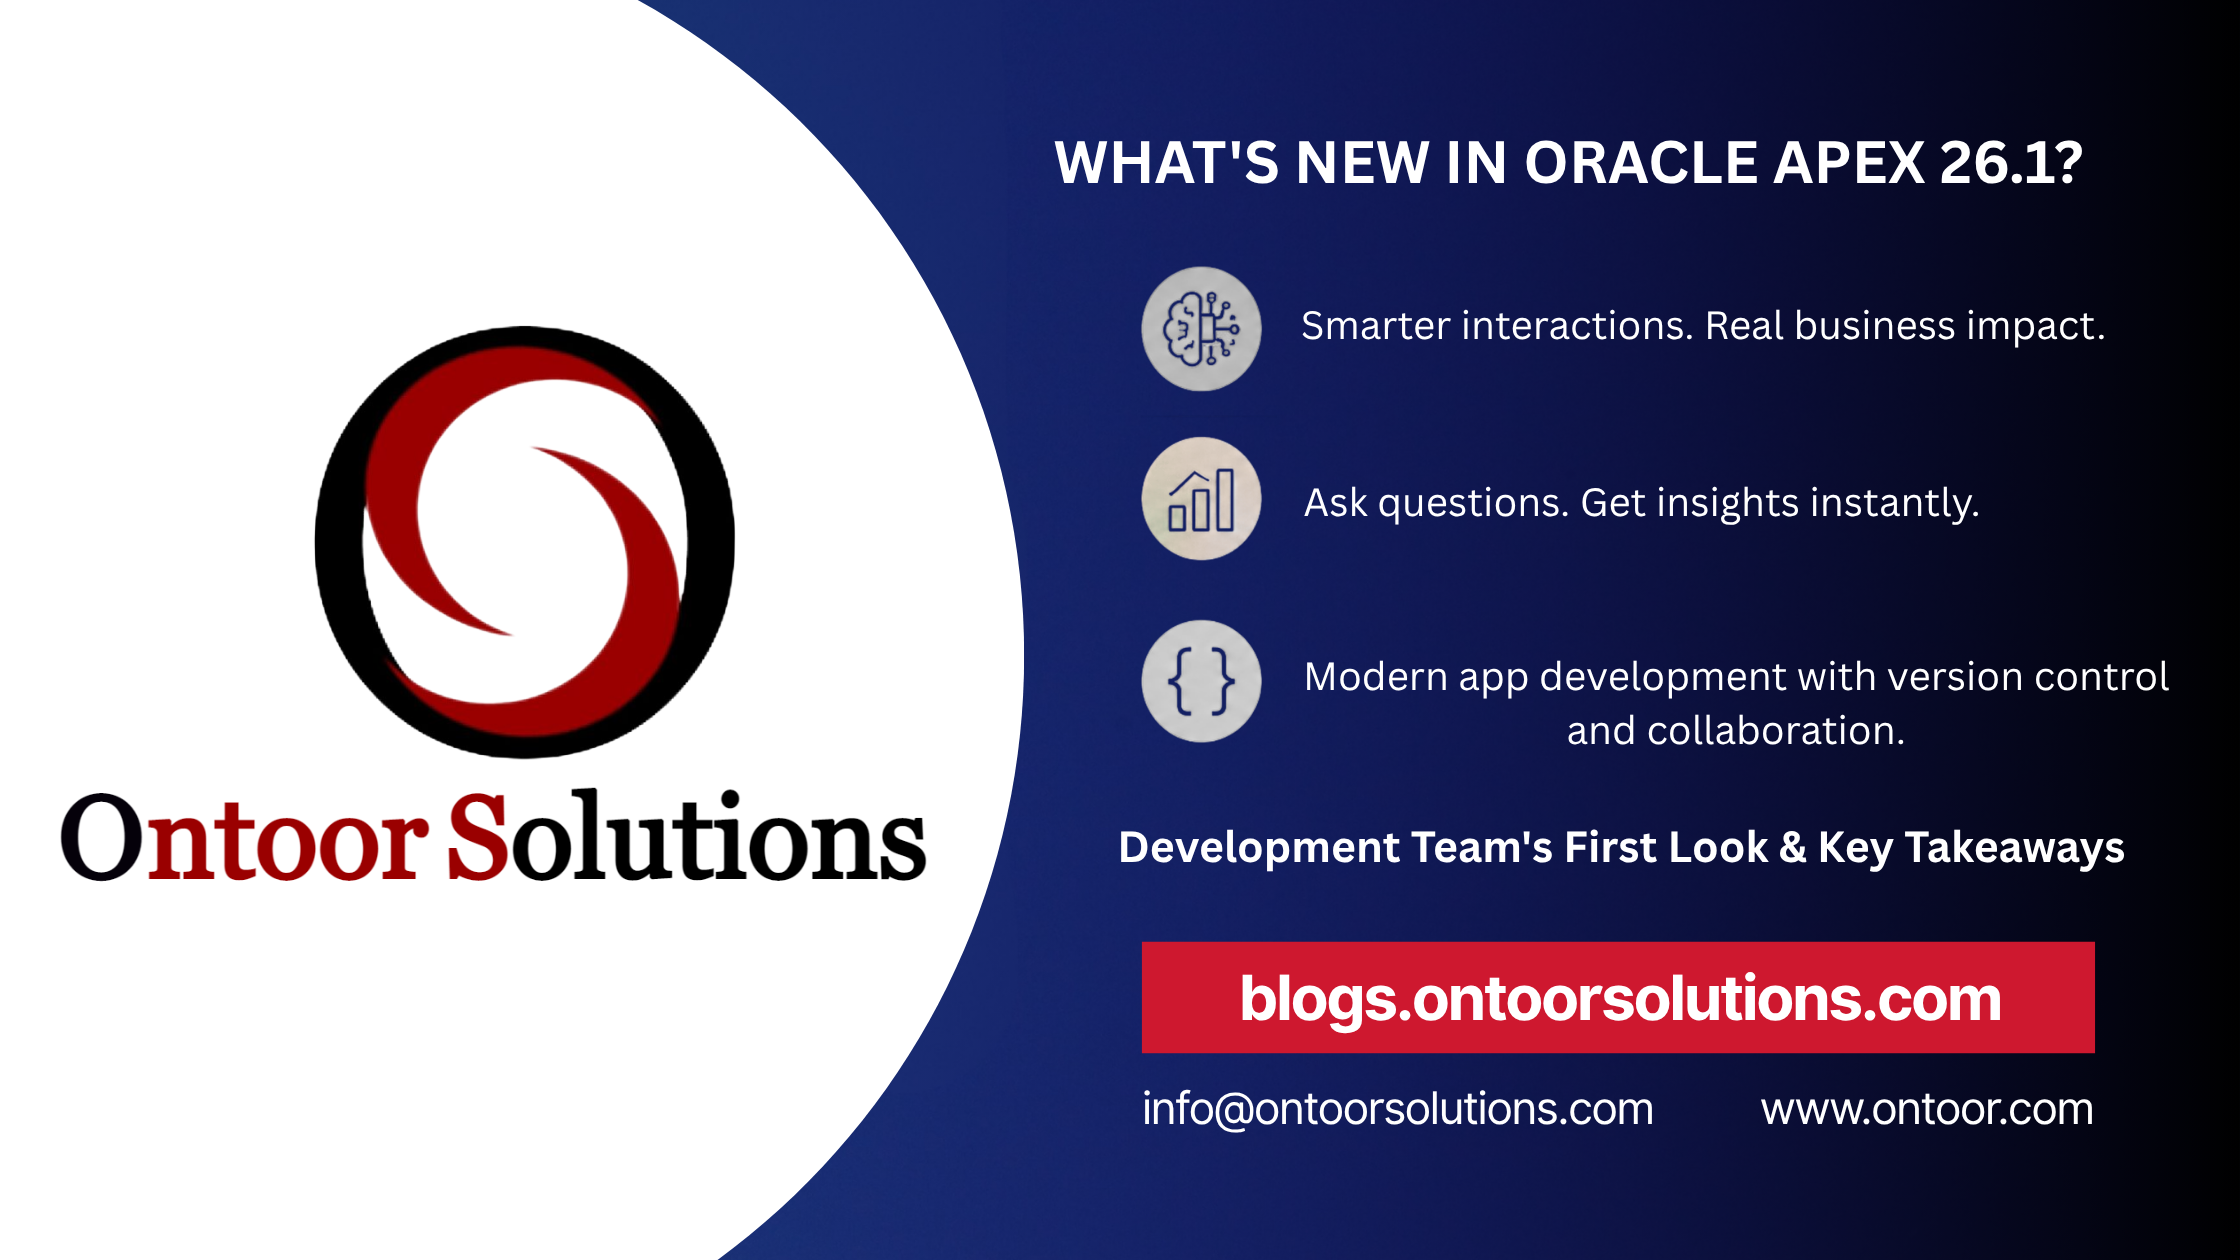
A pie chart is a circular statistical graphic, which is divided into slices to illustrate numerical proportion. In a pie chart, the arc length of each slice is proportional to the quantity it represents. Pie charts are very useful for... Read more
A line chart is a graphical representation of data that changes over time. It is useful for showing trends and patterns in data over a period of time. In a line chart, data points are plotted on a grid and... Read more
Open Door Credentials – Enables anyone to access your application using a login page that captures a user name. Steps to setup Open Door Credentials Parent Article: Authentication Types Read more
Custom Authentication is the Authentication type where we can use the custom logic to login into the APEX application. They need to be written in PLSQL and must return a Boolean value. An “Authentication Function Name” is required to define... Read more
An area chart is a graphical representation of data that uses two axes (horizontal and vertical) and multiple data series to show the trends and variations in data over time. 3. Click on the “Create Page” button in the top... Read more
Below are the Chart Types available in APEX. Region Types in APEX Read more

In this Short Video Vikas has explained, how to change or setup Application Image and Favicon. Read more
Form: Allows users to enter and update data in a database table or view. 1..Log in to Oracle APEX and select the application you want to work on.2..Enter your Page Name (Demo) and search in which you want to create a “Forms”. 3..Click... Read more